
PostHog
Send traces to PostHog
PostHog is an open-source product analytics platform that helps you understand user behavior. With PostHog’s LLM analytics, you can track and analyze your AI application usage.
In PostHog, navigate to your project settings:
phc_...)Go to Settings > Observability and toggle Enable Broadcast.
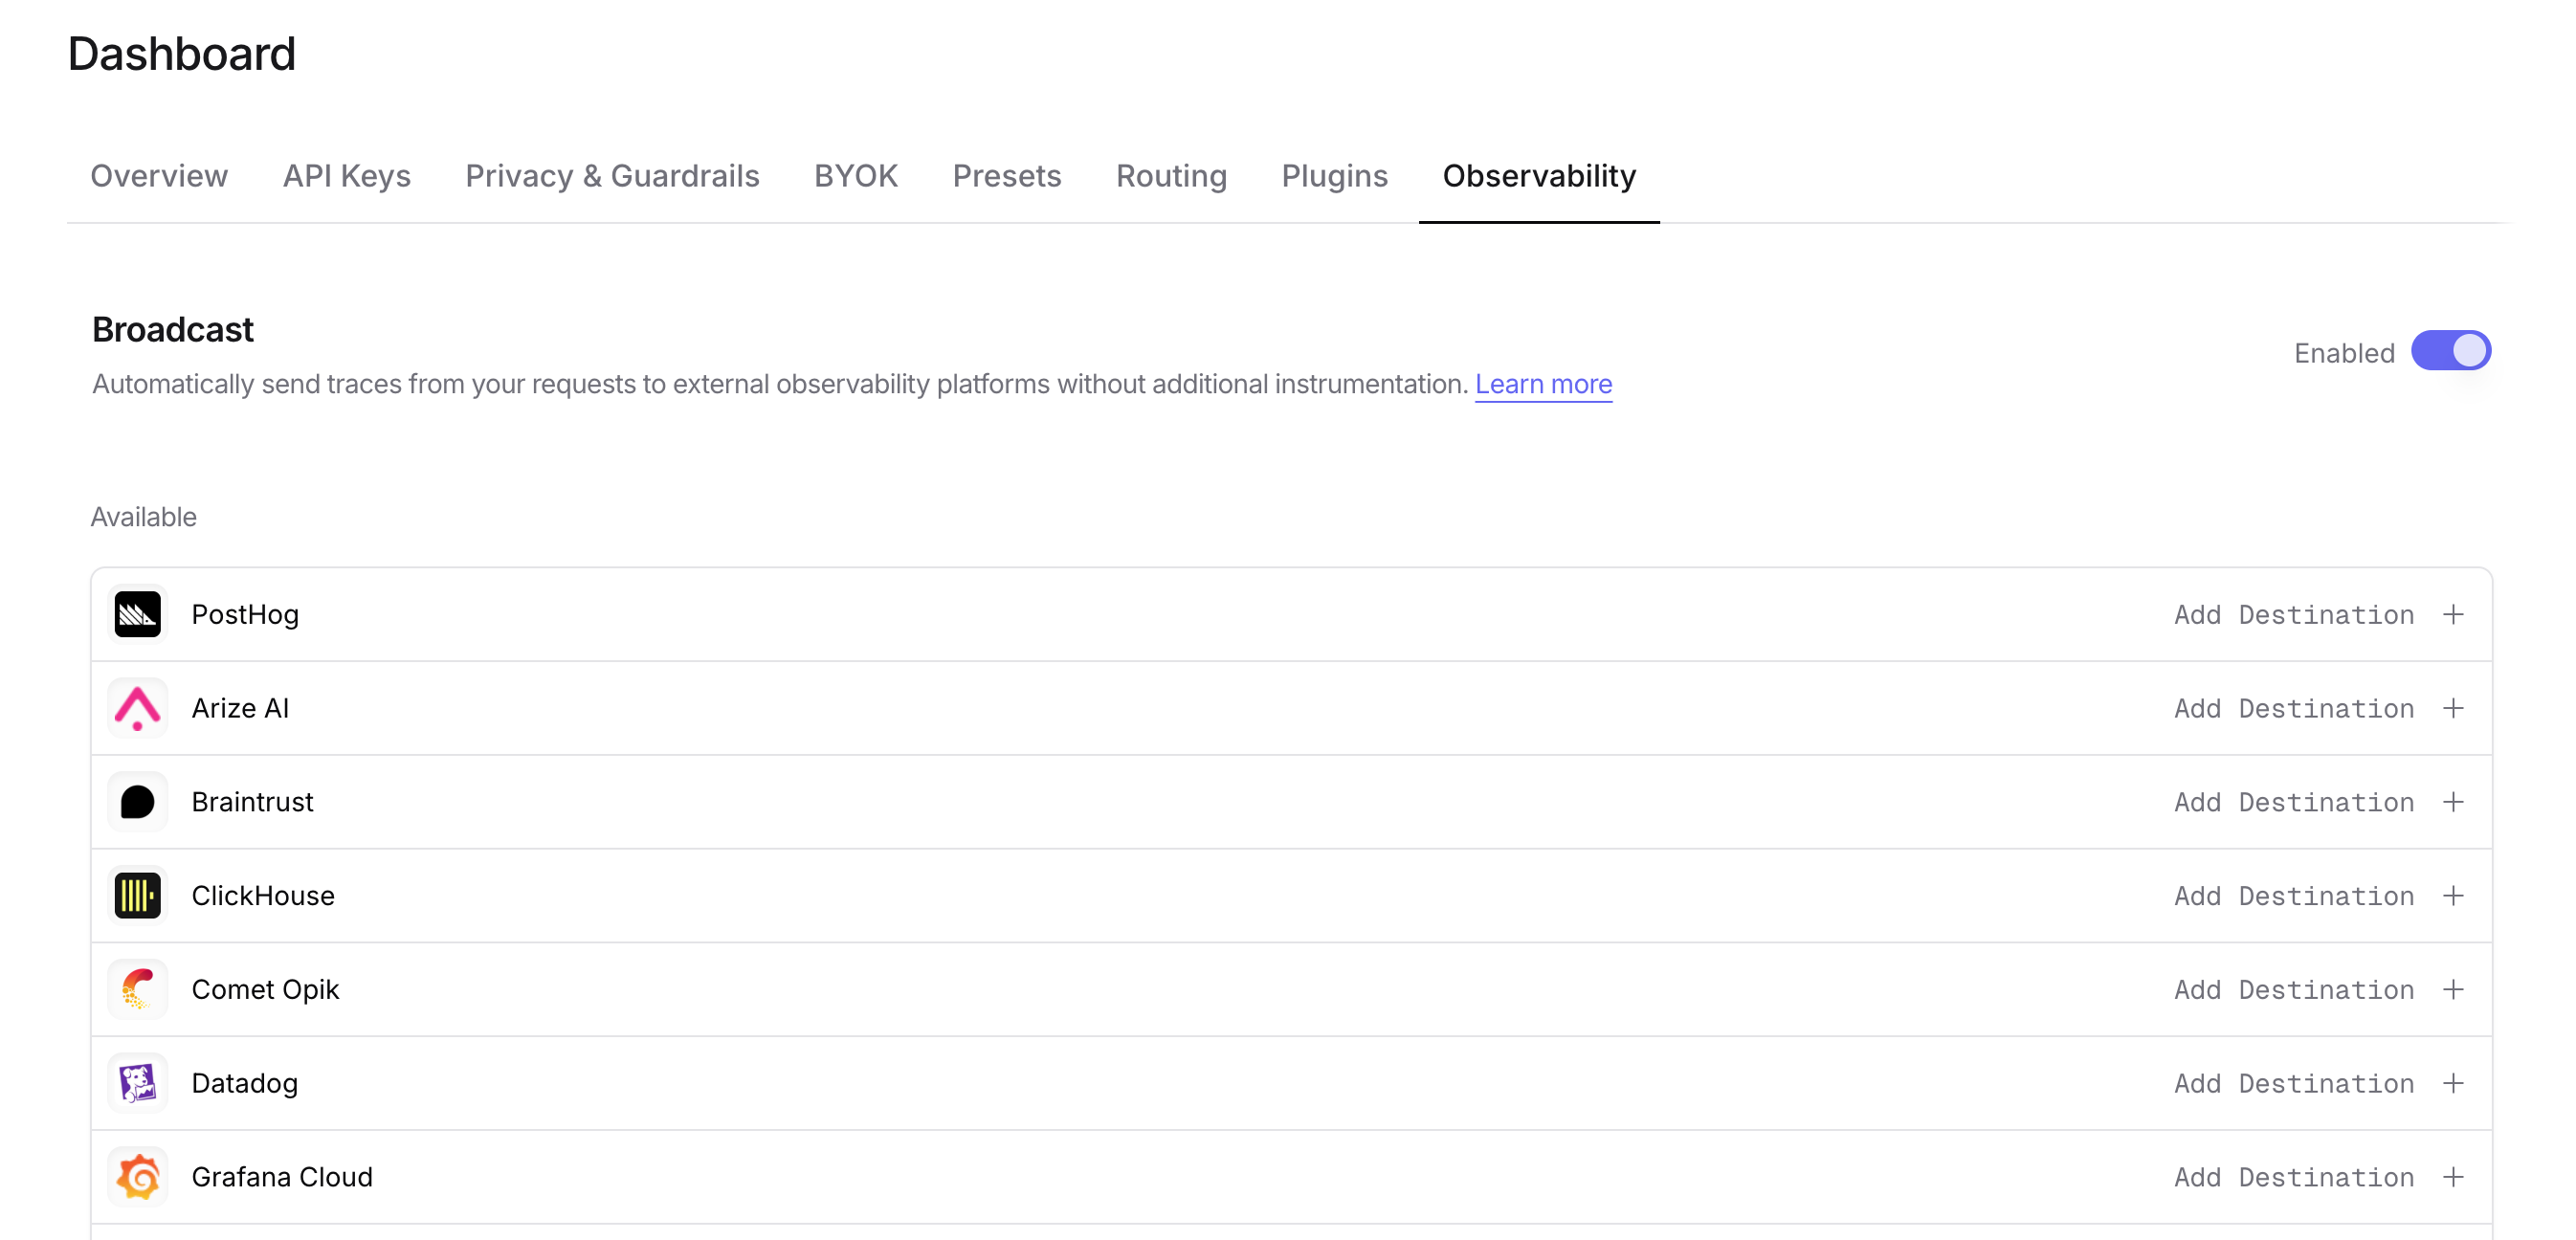
Click the edit icon next to PostHog and enter:
phc_...)https://us.i.posthog.com. For EU region, use https://eu.i.posthog.comClick Test Connection to verify the setup. The configuration only saves if the test passes.
Make an API request through OpenRouter and view the LLM analytics in your PostHog dashboard.
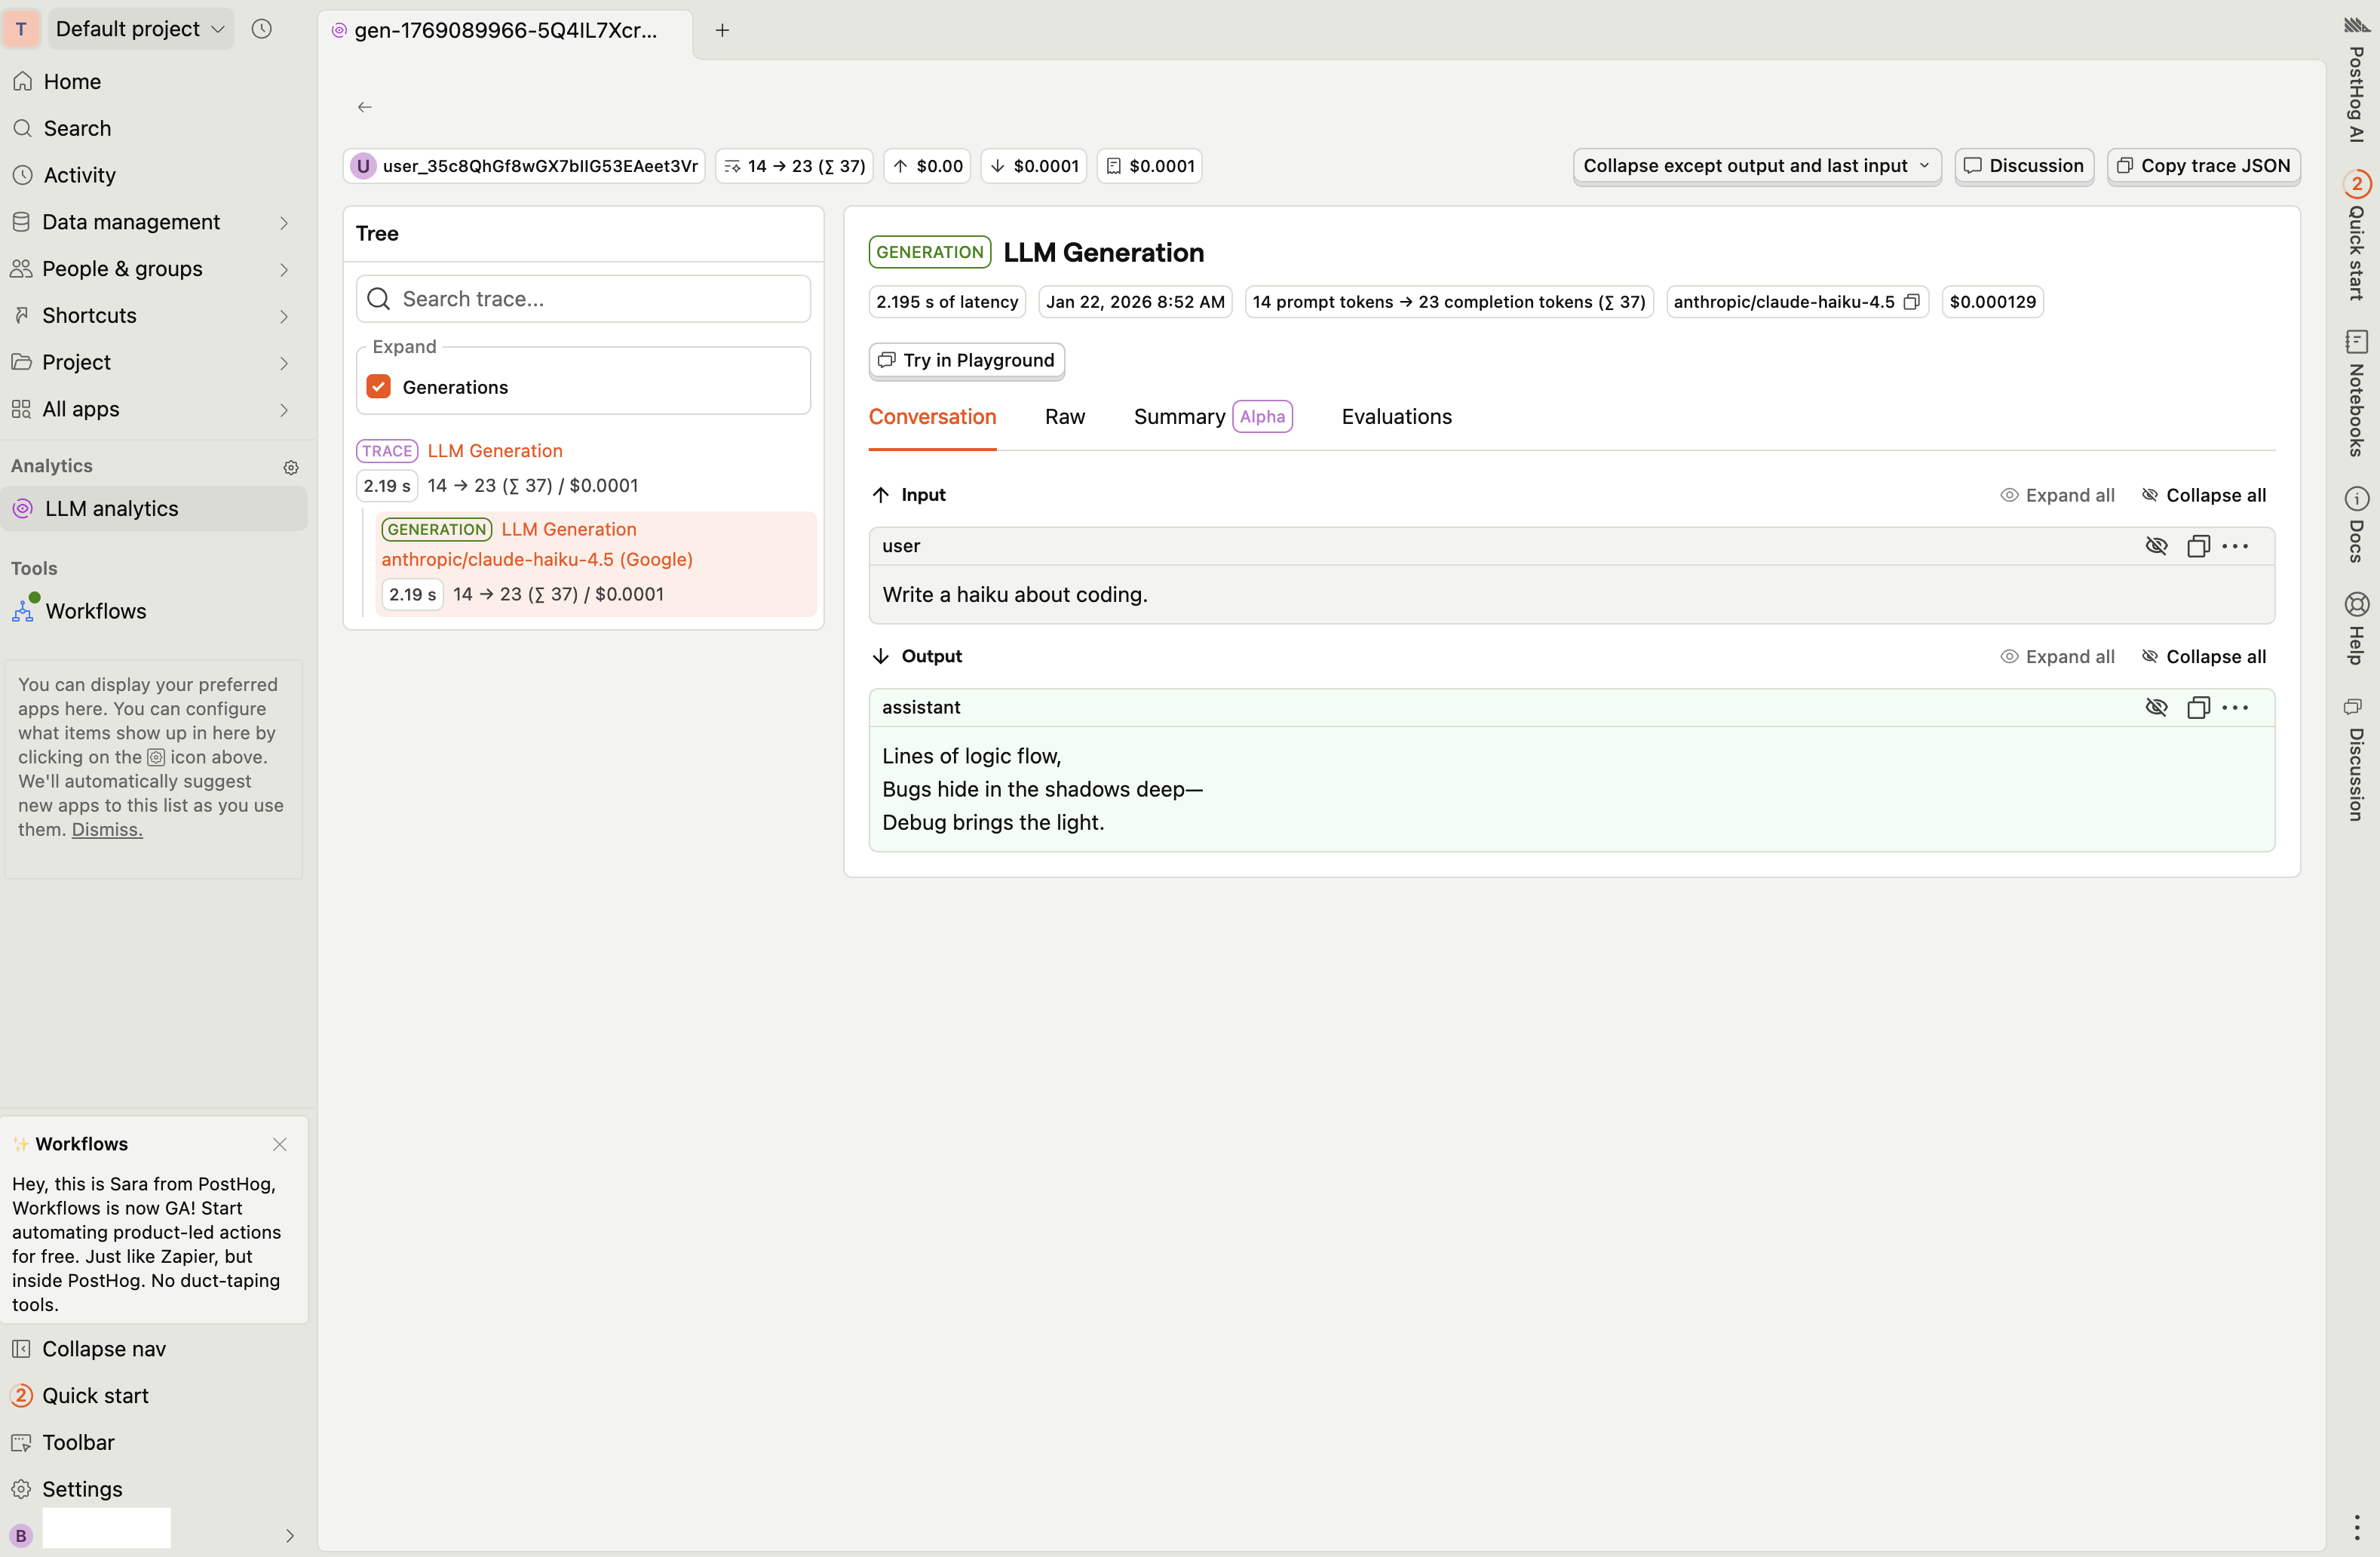
PostHog receives LLM analytics events with custom metadata included as event properties. Use the trace field to attach additional context to your analytics data.
OpenRouter maps the reserved trace fields below to PostHog’s native $ai_* properties,
which power PostHog’s built-in LLM analytics dashboards.
trace_name is forwarded as a plain custom property trace_name (not as $ai_trace_name),
so you can filter events by trace name in PostHog without knowing PostHog’s $ai_* naming
convention.
Every other key inside trace that is not in the table above is forwarded as
metadata_<key> (e.g. feature → metadata_feature).
Depth cap: Custom property values are limited to 3 levels of nesting. Values nested deeper than 3 levels are replaced with
'[truncated]'. This keeps event payloads compact and PostHog parse latency low.
The above request produces a $ai_generation event with these properties (among others):
user field maps to PostHog’s distinct_id for user-level LLM analyticssession_id field maps to $ai_session_id for session groupingWhen Privacy Mode is enabled for this destination, the $ai_input and $ai_output_choices properties are excluded from events. All other analytics data — token usage, costs, model information, and custom metadata — is still sent normally.